Data existed. Decisions didn't.
Thena's customers — B2B SaaS companies running customer support through Slack — were generating thousands of support signals every week. But there was no way to see them. Teams managed by feel: anecdote, intuition, whoever shouted loudest in the weekly standup.
Leadership teams had no visibility into ticket trends, SLA performance, or account health. Support managers couldn't answer basic questions like "which account is most at risk this quarter?" without a manual Slack export and a spreadsheet.
"Our customers were sitting on a goldmine of support signal. They just had no way to read it. We needed to build the instrument."
The problem in numbers
- 200+ B2B SaaS companies processing support through Thena
- Zero native analytics — teams used Slack exports and spreadsheets
- No SLA monitoring, no trend detection, no account-level health view
- Customer success teams flying blind on account risk signals
- No voice-of-customer data to feed into product roadmaps
- Leadership reviews relied on manually compiled weekly decks
What 20+ customer interviews revealed.
Before writing a single requirement, I ran structured discovery with 20+ customers — support managers, heads of CX, and VP-level stakeholders. Three themes surfaced repeatedly.
-
01
SLA visibility was the top-requested feature
Every team had SLAs — first response time, resolution time. None could monitor them in real time. Breaches were discovered reactively, after the customer had already escalated. The ask was: alert me before it happens, not after.
-
02
Account-level aggregation mattered more than ticket-level detail
Teams did not want to look at individual tickets — they wanted to understand account health. Which accounts had the most open requests? Which had the worst CSAT? Which were trending up or down over time? The unit of analysis was the account, not the ticket.
-
03
Leadership needed a weekly brief, not a dashboard
Executives did not want to log in and explore — they wanted a consistent set of metrics they could review in 10 minutes every Monday. The insight platform needed to support both exploratory analysis and repeatable reporting.
What we built — and why each piece mattered.
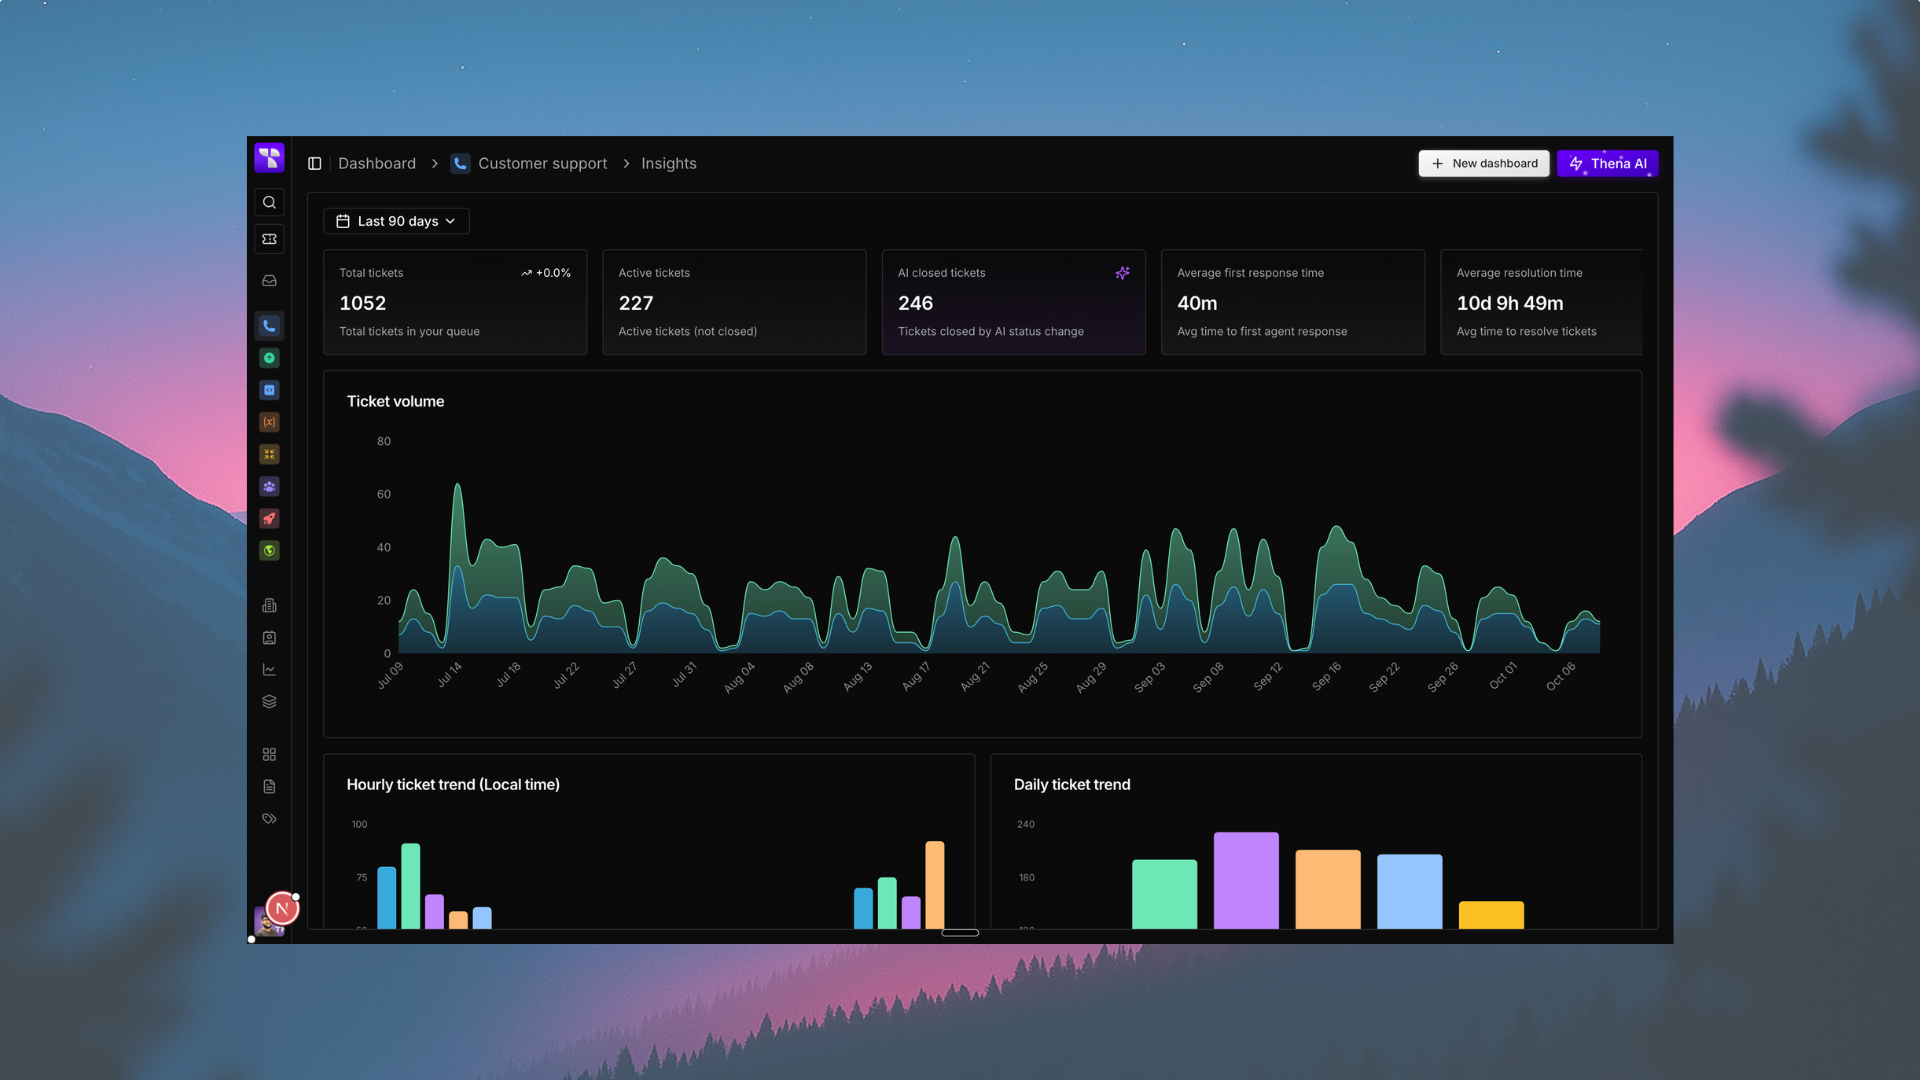
Request volume analytics
Track total, open, tracked, and discarded requests with period-over-period trend comparisons. Visualise volume over time, broken down by account, assignee, or custom field. Built with flexible date range filtering — any 7/30/90/custom window.
SLA monitoring
Real-time tracking of first response and resolution SLA adherence with configurable thresholds per account tier. Breach alerts surfaced proactively — not reactively. p50/p90 time percentile breakdown for nuanced performance reading.
CSAT tracking
Aggregate CSAT scores across any date range with account-level and assignee-level breakdowns. Trend lines identify whether customer satisfaction is improving or degrading. Correlate CSAT dips with volume spikes and SLA breaches.
AI insights layer
Sentiment scoring and trend detection on top of raw ticket data. Stacked bar charts breaking volume by sentiment (positive / neutral / negative). Voice-of-customer themes surfaced automatically — the topics driving the most frustrated requests, week over week.
Every feature was scoped against a customer job-to-be-done. Nothing went in because it looked good on a dashboard demo. The question throughout design was always: what decision does this number enable?
How AI turns data into direction.
Volume charts tell you what happened. AI tells you why — and what to do next. The AI insights layer sits on top of the core analytics and extracts signal that would otherwise require an analyst to surface manually.
Sentiment priority was one of the first AI features shipped: every inbound request is scored and the results flow into the analytics view. Teams can now filter by sentiment — seeing which accounts are generating the most frustrated traffic, and when the frustration spiked.
The longer-term vision is auto-generated weekly briefs: a concise AI-written summary of what changed this week, which accounts need attention, and what product issues are driving the most noise. Reducing the gap between data and decision to near-zero.
AI capabilities in the platform
- Sentiment classification on all inbound requests (positive / neutral / negative)
- Sentiment-based volume filtering and stacked bar visualisation
- Correlation of sentiment signals with SLA breaches and CSAT dips
- Topic clustering to surface voice-of-customer themes
- Urgency scoring: combined sentiment + SLA status for request prioritisation
- AI-assisted anomaly detection on volume and CSAT trend lines
What shipped, and what it delivered.
Within the first quarter post-launch, 50+ teams across Thena's customer base had integrated the insights platform into their support workflows — without a single forced onboarding session.
The platform became the system of record for leadership reporting. Decks that previously required hours of manual compilation are now generated directly from the Insights dashboard.
Customers using Thena's AI copilot and insights together saw CSAT improve from baseline to 8.8/10 — a 6-point gain attributed to faster, more informed response decisions.
Teams moved from reactive breach discovery (after the customer complained) to proactive monitoring — SLA alerts fire before breaches happen, reducing escalations significantly.
What I'd do differently.
The biggest mistake early on was building the analytics infrastructure before validating the exact views customers would actually use. We over-engineered flexibility — too many filter combinations, too many views — before we understood which 20% of the product would drive 80% of the value.
A tighter v1 scope — focused purely on SLA monitoring and volume trends — would have shipped faster and learned more. We course-corrected, but it cost us a sprint and a half.
Key learnings
- Analytics products need a clear primary job-to-be-done — "see everything" is not a job
- Default views matter more than custom views — most users never open the filter panel
- AI features need human-readable explanations attached — numbers without context create anxiety, not confidence
- Adoption is not the same as usage — track depth of engagement, not just logins
- Leadership and operator personas have fundamentally different needs — build for both explicitly